
Contact : Vincent Vivier
Principle
Various experimental techniques based on the use of electrochemical impedance spectroscopy (EIS) have been developed to better understand local electrochemical processes, mainly for corrosion studies. This type of measurement makes it possible to map the local current density above a sample but also to determine the local electrochemical impedance (SIEL) at different positions.1-2 Thus, the detection of anodic and cathodic sites is possible when the size of these sites is in the same range or larger than the dimensions of the probe used.
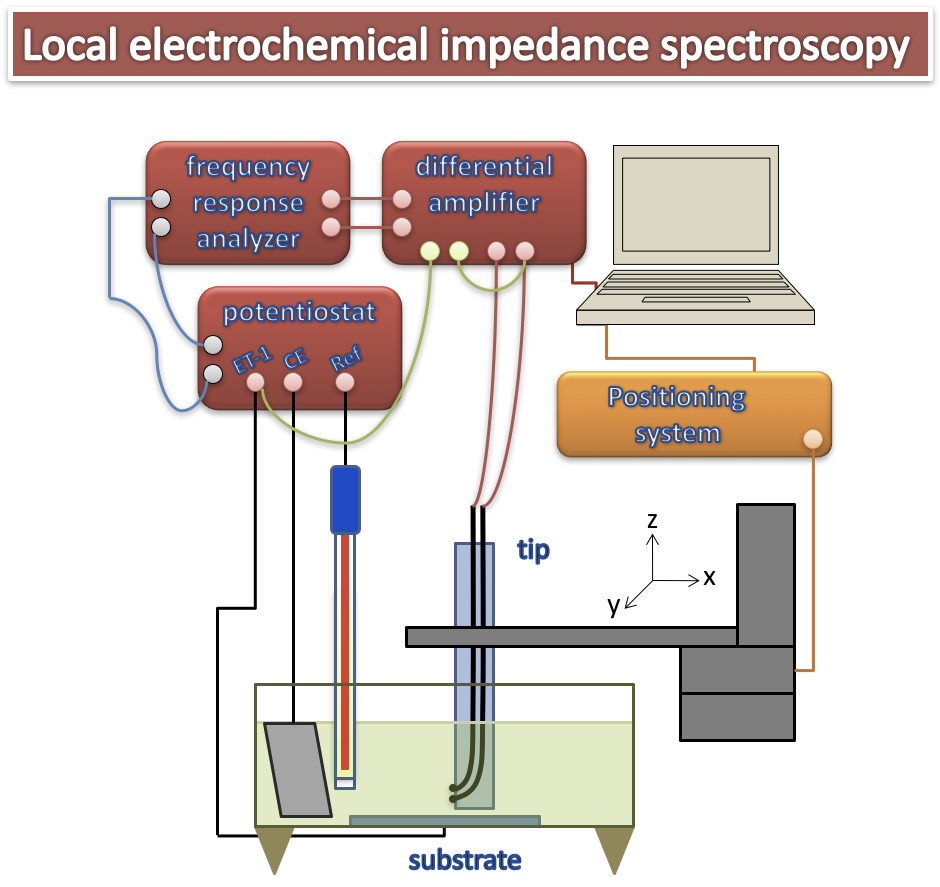
Based on the early work of Isaac,3-4 reference bi-microelectrodes (Ag/AgCl) have been developed to eliminate artifacts related to concentration gradients that may exist in the vicinity of the interface. The arrangement used to perform local electrochemical impedance measurements is shown in Figure 1 and consists of a conventional setup for performing an electrochemical impedance measurement on a usual three-electrode system. The SIEL is based on the measurement of the local current density by means of the bi-microelectrode brought in the vicinity of the electrochemical interface by means of a micrometric positioning system. The potential difference measured at the terminals of the dual-microelectrode is amplified and converted to local current density and the use of a multi-channel transfer function analyzer allows the simultaneous measurement of the different local and global impedances.5-6
Local impedance diagrams
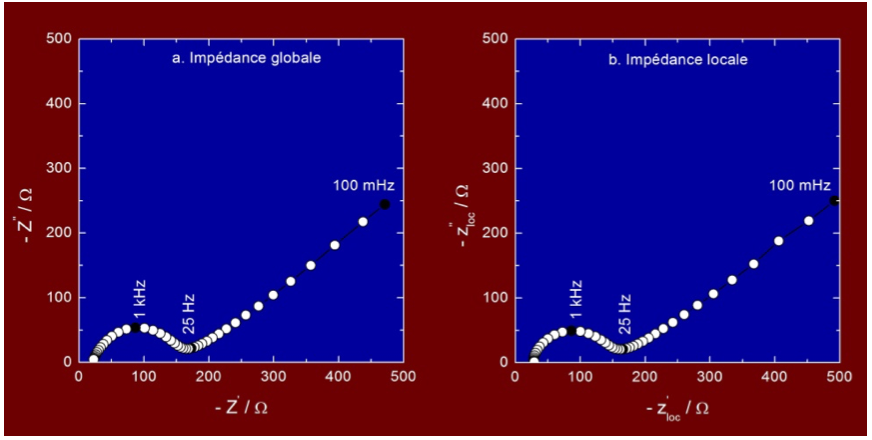
Figure 2 shows an electrochemical impedance diagram measured in a potassium ferri/ferro-cyanide solution at the equilibrium potential for a 2 mm in diameter gold electrode (with a homogeneous reactivity), and the diagram obtained when the LEIS probe is positioned above the center of the gold electrode. The shape and the amplitude of the local curve are comparable in all details to the global impedance diagram. In high-frequency domain, the intersection with the abscissa axis allows to determine the electrolyte resistance, the capacitive loop is ascribed to the charge transfer resistance in parallel with the double layer capacitance, and the linear part of the diagram corresponds to the Warburg impedance (i.e. to the diffusion of electroactive species). This type of measurement makes it possible to study the local reactivity of a material, as well as to highlight time constant distributions that can usually be described by constant phase elements (CPE).7-9
Imaging using LEIS
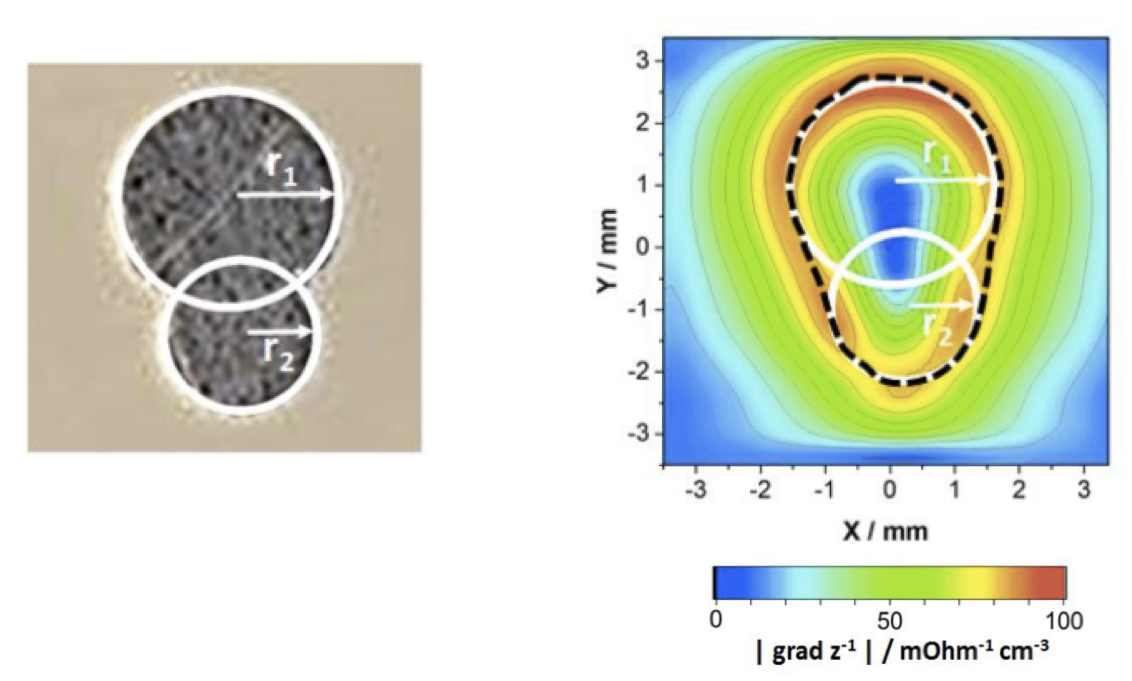
A frequently used mode of the LEIS is the imaging of the surface reactivity at a constant frequency. It is thus possible to obtain variations in local reactivity in the form of maps representing the impedance or admittance modulus at a given frequency as a function of the position of the probe.10 For example, Figure 3 illustrates the possibility of imaging active surfaces with local impedance.
Application to corrosion
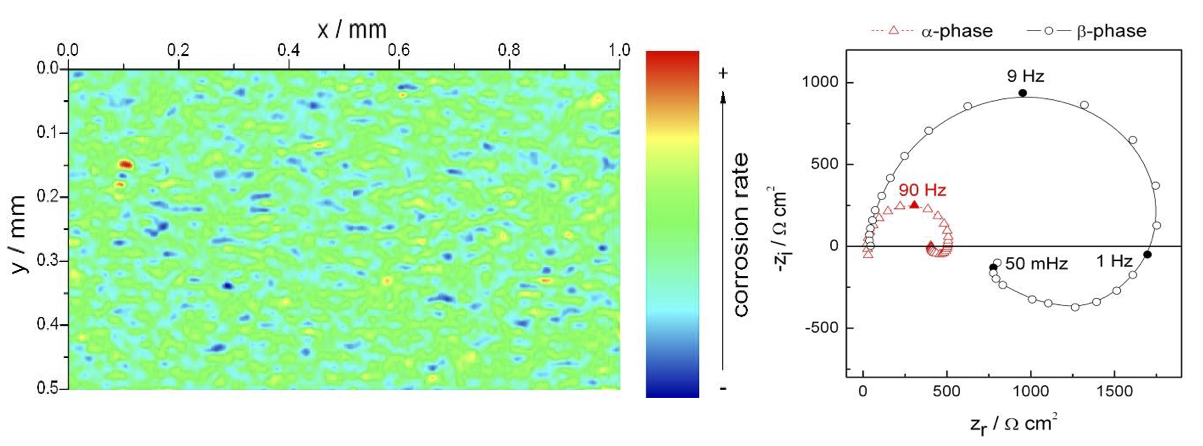
Local electrochemical impedance spectroscopy measurements have so far mainly found applications in corrosion. Figure 4 shows the reactivity of a two-phase magnesium alloy, the AZ91 alloy, in Na2SO4 solution at 100 Hz.11 The more or less reactive domains of the material are thus highlighted, the most reactive zones (smaller impedance) corresponding to the preferential dissolution of the a-phase which is richer in Mg than the ß-phase. However, the interpretation of these maps is often limited to the qualitative highlighting of more or less active areas and it is therefore preferable to determine the different domains by making an image, and then by recording local impedance diagrams at different points to quantitatively analyze the kinetics of the processes. Indeed, we observe on the LEIS measurements (figure 4 - right) that the mechanisms involved are the same for both phases of the alloy, but that the difference in amplitude of the diagrams makes it possible to quantify the difference in dissolution kinetics of the two phases. This approach, less common than fixed frequency imaging, requires the use of small diameter electrodes to obtain both good spatial resolution and quantitative analysis of the results.
Equipment developed at LISE
The devices used at LISE were developed in the laboratory. They allow the size of the probe to be adapted (from a few micrometers to a few millimeters) depending on the nature of the sample to be analyzed. They consist of a positioning system, a potentiostat and a multi-channel frequency analyzer allowing simultaneous measurement of local and global impedances, and possibly other transfer functions. This approach is unique to date.
References
- Frateur, I.; Huang, V. M.-W.; Orazem, M. E.; Pebere, N.; Tribollet, B.; Vivier, V., Local electrochemical impedance spectroscopy: Considerations about the cell geometry. Electrochim. Acta 2008, 53 (25), 7386-7395.
- Huang, V. M.-W.; Wu, S.-L.; Orazem, M. E.; Pebere, N.; Tribollet, B.; Vivier, V., Local electrochemical impedance spectroscopy: A review and some recent developments. Electrochim. Acta 2011, 56, 8048-8057.
- Lillard, R. S.; Moran, P. J.; Isaacs, H. S., A novel method for generating quantitative local electrochemical impedance spectroscopy. J. Electrochem. Soc. 1992, 139 (4), 1007-1012.
- Zou, F.; Thierry, D.; Isaacs, H. S., A high-resolution probe for localized electrochemical impedance spectroscopy measurements. J. Electrochem. Soc. 1997, 144 (6), 1957-1965.
- Huang, V. M.-W.; Vivier, V.; Orazem, M. E.; Pebere, N.; Tribollet, B., The apparent constant-phase-element behavior of an ideally polarized blocking electrode a global and local impedance analysis. J. Electrochem. Soc. 2007, 154 (2), C81-C88.
- Huang, V. M.-W.; Vivier, V.; Orazem, M. E.; Pebere, N.; Tribollet, B., The apparent constant-phase-element behavior of a disk electrode with Faradaic reactions. A global and local impedance analysis. J. Electrochem. Soc. 2007, 154 (2), C99-C107.
- Hirschorn, B.; Orazem, M. E.; Tribollet, B.; Vivier, V.; Frateur, I.; Musiani, M., Determination of effective capacitance and film thickness from constant-phase-element parameters. Electrochim. Acta 2010, 55 (21), 6218-622
- Hirschorn, B.; Orazem, M. E.; Tribollet, B.; Vivier, V.; Frateur, I.; Musiani, M., Constant-Phase-Element Behavior Caused by Resistivity Distributions in Films: II. Applications. J. Electrochem. Soc. 2010, 157 (12), C458-C463.
- Musiani, M.; Orazem, M. E.; Pebere, N.; Tribollet, B.; Vivier, V., Constant-Phase-Element Behavior Caused by Coupled Resistivity and Permittivity Distributions in Films. J. Electrochem. Soc. 2011, 158, C424-C428.
- Shkirskiy, V.; Volovitch, P.; Vivier, V., Development of quantitative Local Electrochemical Impedance Mapping: an efficient tool for the evaluation of delamination kinetics. Electrochim. Acta 2017, 235, 442-452.
- Galicia, G.; Pebere, N.; Tribollet, B.; Vivier, V., Local and global electrochemical impedances applied to the corrosion behaviour of an AZ91 magnesium alloy. Corros. Sci. 2009, 51 (8), 1789-1794.